")
“JMeter Performance Testing Basics to Master with BeanShell, Prometheus, Grafana, Jenkins, AppDynamics, Kubernetes, Docker & AI- Powered Testing” – Live Training
This course is designed to help you master JMeter Performance Testing from basics to advanced real-world implementation. You’ll start with core performance testing concepts and gradually move into enterprise-level tools and modern DevOps integrations.
You will learn how to design, execute, and analyze performance tests using Apache JMeter, including scripting with BeanShell for dynamic and complex scenarios. The course also covers monitoring and observability using Prometheus and Grafana, enabling you to visualize performance metrics effectively.
To prepare you for real industry environments, the course includes CI/CD integration using Jenkins, application performance monitoring with AppDynamics, and containerized performance testing using Docker and Kubernetes. You’ll also get introduced to AI-powered performance testing techniques to enhance test optimization, analysis, and decision-making.
By the end of this course, you’ll be confident in building scalable performance test frameworks and handling performance challenges in cloud-native and enterprise applications.
About the Instructor:
|
Vishnu M is an EX-IITian with 14+ years of extensive industry experience in Performance Testing, Performance Engineering, and AI-Driven Testing. He has worked on complex, large-scale enterprise applications, focusing on system scalability, reliability, optimization, and testing AI/LLM-based systems. His strong foundation in both traditional performance testing and modern AI testing technologies positions him as a trusted expert in next-generation quality engineering. He brings strong hands-on expertise with industry-leading tools such as Apache JMeter, Micro Focus LoadRunner, AppDynamics, and Dynatrace. Vishnu also specializes in AI & LLM Testing, prompt validation, model behavior testing, Chaos Engineering, and advanced performance monitoring and observability. His ability to combine performance engineering, AI testing, and resilience testing helps learners understand how to test modern, intelligent, and highly scalable systems. With an unmatched passion for teaching, Vishnu has 12+ years of technical training experience and has trained 700+ students over the last 5 years. His sessions are highly interactive, hands-on, and easy to follow, with a strong focus on real-time use cases and practical exercises. He has a natural talent for simplifying complex performance, AI, and observability concepts, making his training highly effective for both beginners and experienced professionals. |
Sample Demo Video:
“JMeter Performance Testing Basics to Master with BeanShell, Prometheus, Grafana, Jenkins, AppDynamics, Kubernetes and Docker”-Demo session Video
“JMeter Performance Testing Basics to Master with BeanShell, Prometheus, Grafana, Jenkins, AppDynamics, Kubernetes and Docker”-Day 1 session Video
Live Sessions Price:
For LIVE sessions – Offer price after discount is 300 USD 259 109 USD Or USD13000 INR 12900 INR 8900 Rupees
OR
✨ Recently, we have completed the demo sessions for our current batch. The next batch will be scheduled soon.
📌 To know more details and get complete information about the course, please register using the “Enroll for Free Demo” button, or you can directly reach out to us using the WhatsApp button below.
🙏 Thank you for your interest! Once the new batch date and time are finalized, we will get in touch with you.
What will I learn by the end of this course?
- Understand performance testing concepts and different testing types
- Install, configure, and work confidently with Apache JMeter
- Create and enhance JMeter scripts using best practices
- Handle dynamic values using correlation, parameterization, and regex
- Implement realistic load scenarios with threads, ramp-up, and pacing
- Execute tests in GUI and Non-GUI modes and generate HTML reports
- Debug JMeter scripts and analyze performance results effectively
- Integrate JMeter with Jenkins, AppDynamics, Grafana, Docker, and Kubernetes
- Perform distributed load testing for large-scale applications
- Use AI to generate scripts, optimize load setup, and analyze results faster
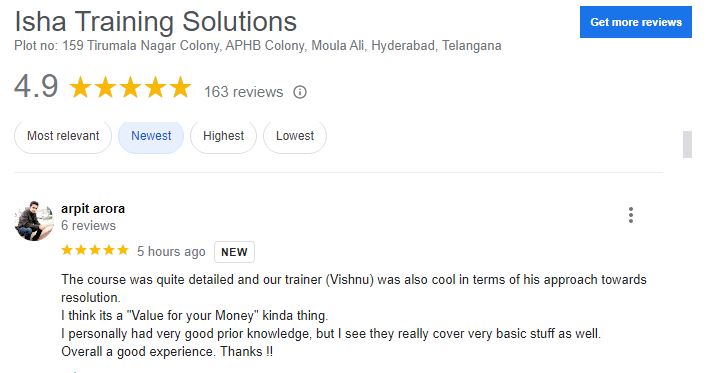
What student’s have to say about Vishnu:
| I had enrolled for Jmeter course by Vishnu sir, this was a really great course for beginning the journey for any performance tester. Vishnu sir is a great teacher and has tried to clear the concepts of performance testing very thoroughly, quite satisfied with the course. Thanks to Vishnu sir and Isha training solutions! – Satanu Bagchi
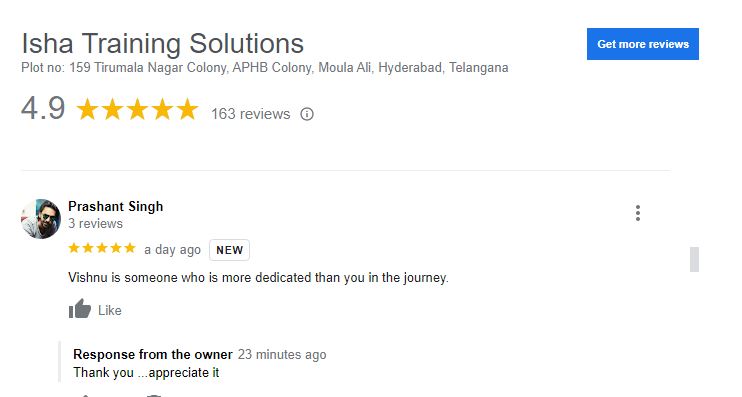
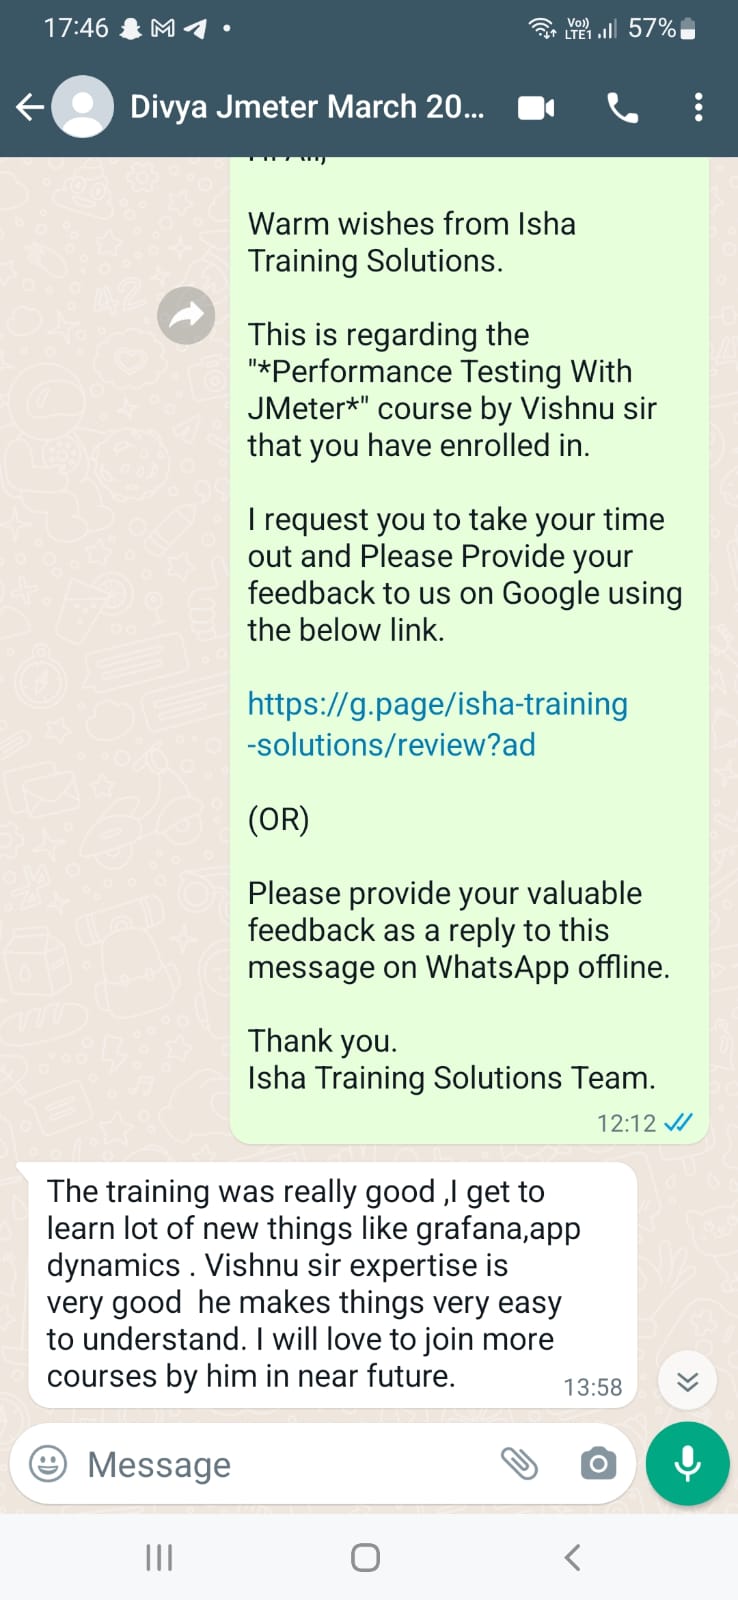
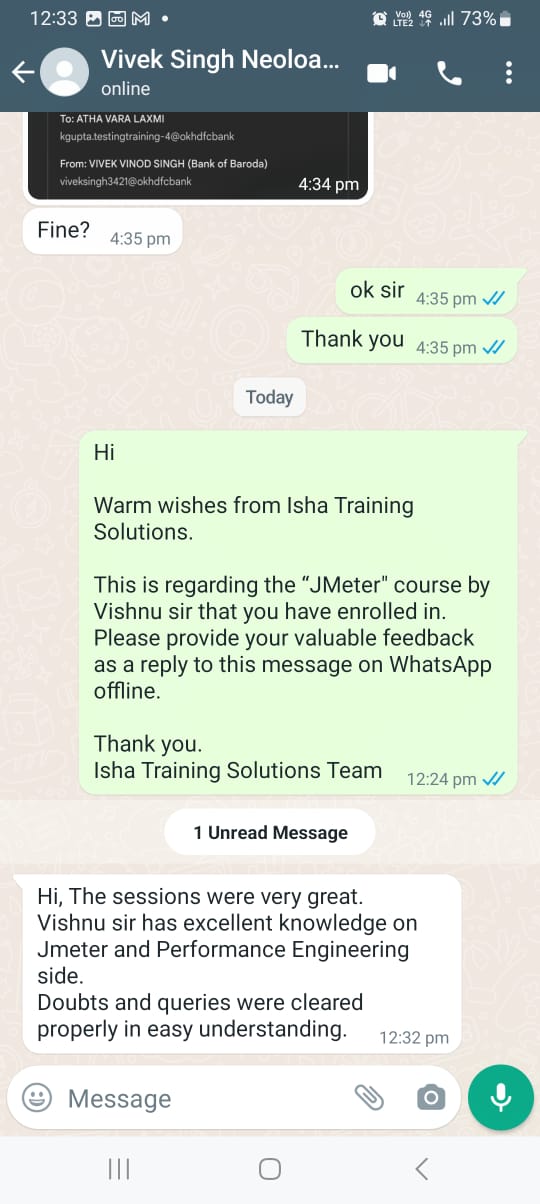
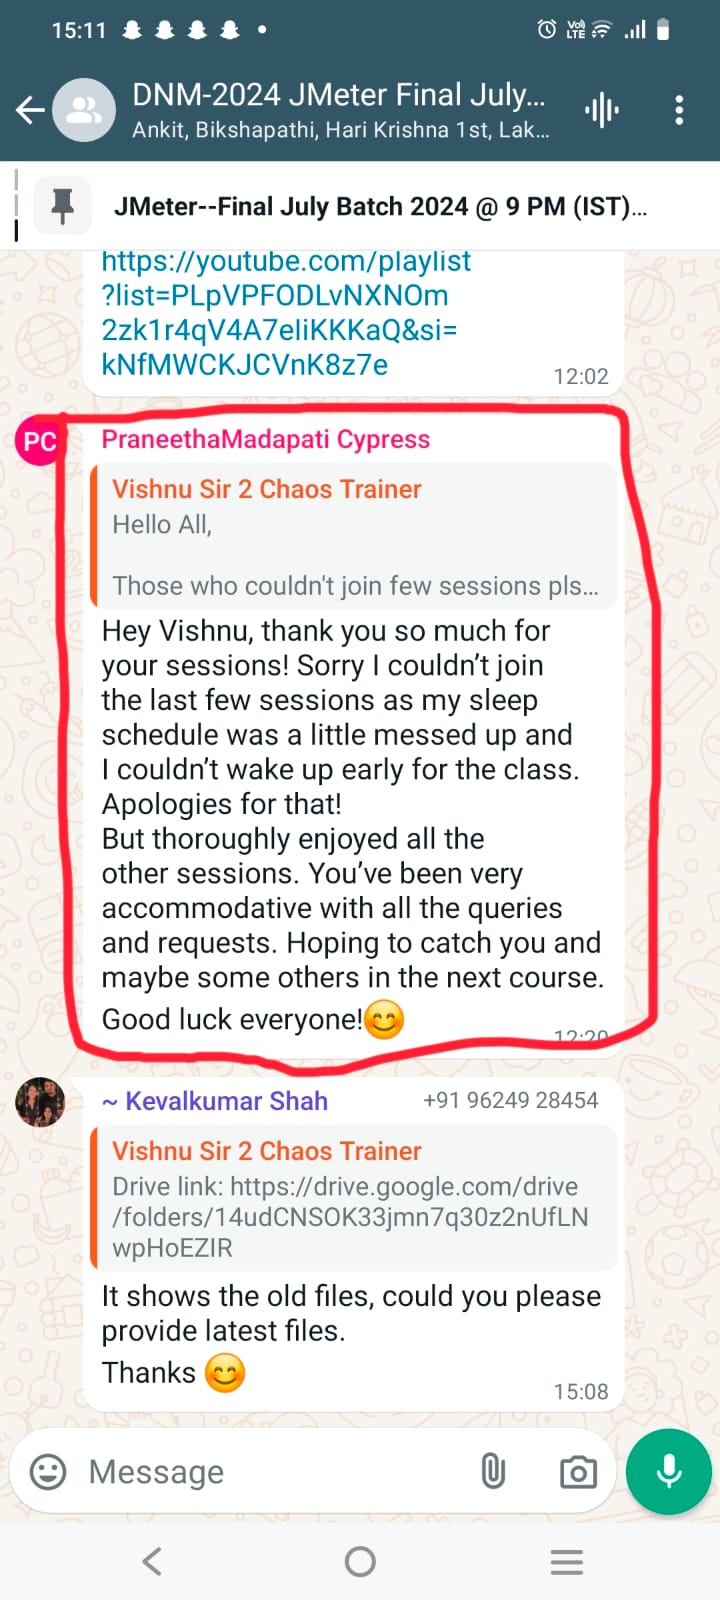
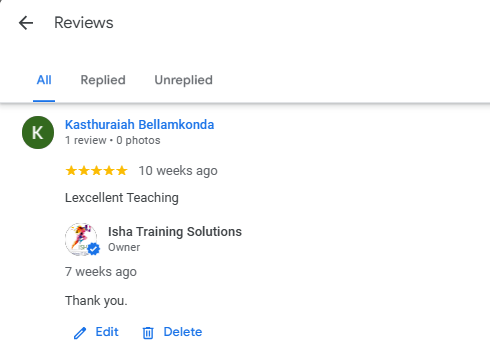
Hey Vishnu, thank you so much for your sessions! Sorry I couldn’t join the last few sessions as my sleep schedule was a little messed up and I couldn’t wake up early for the class. Apologies for that! But thoroughly enjoyed all the other sessions. You’ve been very accommodative with all the queries and requests. Hoping to catch you and maybe some others in the next course. Good luck everyone!😊 – Praneetha Mandapati It was pleasure meeting with you thru this learning session and get taught on each area what we have doubts in respective of syllabus. it would appreciable and once again thank you for your support and assistance further. 🙏🏻 – Devang Hi @Vishnu Sir 2 Chaos Trainer thanks for all the wonderful insights you have provided throughout the sessions. It was always very lively and being back from my 2nd Maternity break I was somehow a bit less motivated and skeptical but all your classes really helped me brush things up real quick and also helped learning new things.. Will surely keep in touch 😊 – Ramya Hi, The sessions were very great. Vishnu sir has excellent knowledge on Jmeter and Performance Engineering side. Doubts and queries were cleared properly in easy understanding. – Vivek Singh Excellent Teaching – Kasthuraiah Bellamkonda very good session, very composed trainer. – Pallavi khare The training was really good ,I get to learn lot of new things like grafana,app dynamics . Vishnu sir expertise is very good he makes things very easy to understand. I will love to join more courses by him in near future. – Divya The course was quite detailed and our trainer (Vishnu) was also cool in terms of his approach towards resolution. Vishnu is someone who is more dedicated than you in the journey. – Prashant Singh Excellent explanation of Performance testing topics. Very useful for beginners as well as for the experienced people to revise the basics – Micheal.s This course is recommended for a beginner who wants to learn load runner and enter into performance testing background – Naveen The teaching methods are very much interactive. you can learn alot from Vishnu sir. this is the best course i have come across regarding JMeter tool – Sachin Vishnu has been really amazing as of now. He is undoubtedly one of the best instructor who can teach LoadRunner in such a great fashion. – Sneha It is really a nice course which give a beautiful insights in multiple core areas. – Pooja |
Salient Features:
- 40 Hours of Live Training along with recorded videos
- Lifetime access to the recorded videos
- Course Completion Certificate
Who can enroll in this course?
- Manual Testers who want to move into Performance Testing
- Automation Testers looking to add JMeter and performance skills
- Performance Testers aiming to upskill with DevOps, Cloud, and AI tools
- QA Engineers and QA Leads working on web and API applications
- Developers who want to understand and improve application performance
- DevOps, SRE, and Cloud Engineers involved in CI/CD pipelines
- Freshers or beginners interested in starting a career in Performance Testing
- Anyone looking to build real-world, job-ready performance engineering skills
This course will cover each of these topics in-depth, with hands-on exercises and real-world examples to help you master performance testing with JMeter and related technologies.
Highlights of this course:
JMeter: a popular open-source load testing tool
BeanShell: a scripting language used to extend JMeter’s functionality
Grafana: a visualization tool used to create dashboards and reports
Jenkins: a popular continuous integration and continuous deployment (CI/CD) tool
AppDynamics: a performance monitoring tool used to monitor applications
Kubernetes: a container orchestration system used to manage containerized applications
Docker: a containerization platform used to package and deploy applications
This course will cover each of these topics in-depth, with hands-on exercises and real-world examples to help you master performance testing with JMeter and related technologies.
Course syllabus:
Jmeter Introduction & Jmeter core concepts
- JMeter History, Protocols Supported & Its Features
- Java (JDK & JRE) Installation & Java Environment/System Variable (or Home Path) Setup
- JMeter Download, Installation & Launching on Windows & Mac
- HTTP(s) Protocol: – Request, Response, Headers, Request Methods, & Status Codes
- Browser Developer Tool, HTTP/HTML Requests, Embedded Resources, Transaction (or User Action), Cookies, Cache, User Session
- Types of HTTP Request Methods & CRUD Operations: – GET, POST, PUT & DELETE
Jmeter Scripting
- Scripting using Docker, Kubernetes-based demo application running on microservices
- JMeter’s 12 Major Elements (or Components)
- Port & Proxy Server Setup & Recording from Different Browsers
- Filtering Irrelevant Requests & Embedded Resources
- JMeter Certificate Installation in Different Browsers, Recording, & Certificate Regeneration
- HTTP(s) Test Script Recorder Element, Its Attributes, & Its Best Practices Settings
- JMeter’s Recording Best Practices
- Walk-through of JMeter’s Directory: – Various Files & Folders
- JMeter’s Properties Files
- JMeter Plugin Manager & Plugins Installation & Uninstallation
- Scenarios Identification & Documentation for Performance Testing of a Web Application (Product Booking Scenario)
- End to End Recording, Scripting & Enhancement of above Scenarios in JMeter
- JMeter’s Best Practices for Scripting & Enhancement
- Dynamic Values & Authorization Tokens, & Their Handling
- Correlation & Parameterization
- VUsers (or Threads), Ramp Up, Ramp Down, Loop, Think Time, Pacing
- Regular Expression in JMeter
- Regular Expression Extractor with Its Attributes in Detail
- Realtime Use Cases Examples of Dynamic Values Extraction in JMeter
- Beanshell scripting and challenges
Jmeter Test Execution
- Test Execution in Non-GUI Mode with Its Best Practices
- JMeter’s Java Heap Size Setting
- Understanding Test Summarizer
- JMeter HTML Dashboard Report Generation in Non-GUI Mode with Its Best Practices
- Importance of JTL file
- Changing Response Time Values to Seconds in HTML Report
- Decreasing the Summarizer Time
- Stopping Test Execution in Non-GUI Mode
- Test Execution & HTML Report Generation in GUI Mode
- Understanding JMeter HTML Report
- Saving Complete Requests & Responses for Failed Requests of a Test to a File
- Parameterizing Important Parameters Using __P() function & Why to Use this function?
- Passing Arguments from CLI in Non-GUI Execution
- Scope of JMeter Elements & Variables
- Local & Global Variables
- Execution Order (or Presidency) of JMeter Elements
- Relative & Absolute Path Setup in JMeter
- Debugging of Script in JMeter: – 4 helpful options
- CSV Data Set Config & Random CSV Data Set Config
- Distributed Load Testing in JMeter using Load Generators (LGs) in GUI & Non-GUI Modes (Master & Slaves Concept)
- Types of Performance Testing
- Test Run & Reporting
JMeter Elements, Their Sub-Elements & Their Attributes in Detail
- Test Plan
- Non-Test Elements
- Thread Group
- Controller Elements of JMeter
- Sampler Elements of JMeter
- Config Elements of JMeter
- Assertion Elements of JMeter
- Timer Elements of JMeter
- Listener Elements of JMeter
- Pre & Post Processor Elements of JMeter
JMeter Web Services Execution
JMeter REST services Execution
JMeter Integration with Appdynamics, Grafana
Jmeter integration with Jenkins
AI-Powered Performance Testing
AI for Test Script Creation
- Generate basic JMeter scripts using natural language prompts
- Convert user journeys / business flows into JMeter test steps
- Automatically identify and apply:
Parameterization
Correlation handling
Test data generation
Detect and fix common script errors - Assist in creating and analysing NFRs (Non-Functional Requirements)
- Generate performance test plans and strategy automatically
AI for Load Test Setup
- Recommend optimal:
Number of virtual users
Ramp-up time
Test duration - Suggest appropriate load patterns, such as:
Normal load
Spike testing - Analyze test execution data to:
Identify slow or underperforming requests
Highlight bottlenecks early
AI for Result Analysis
- Interpret performance metrics including:
Response time
Throughput
Error percentage - Automatically identify:
Failed requests
Slow APIs or pages
Compare current vs previous test runs - Generate:
Clear test summaries
Root cause analysis (RCA) insights
AI + Monitoring Integration
- Interpret system and application monitoring dashboards
- Explain resource utilization metrics such as:
CPU usage
Memory consumption
Disk and network utilization - Detect and highlight performance anomalies like:
CPU spikes
Memory leaks
Resource saturation
AI for Performance Testers
- Generate JMeter scripts using simple natural language prompts
- Assist in debugging:
Assertion failures
Script execution errors - Auto-generate:
Test case descriptions
Execution reports
Email-ready performance summaries
Live Sessions Price:
For LIVE sessions – Offer price after discount is 300 USD 259 109 USD Or USD13000 INR 12900 INR 8900 Rupees
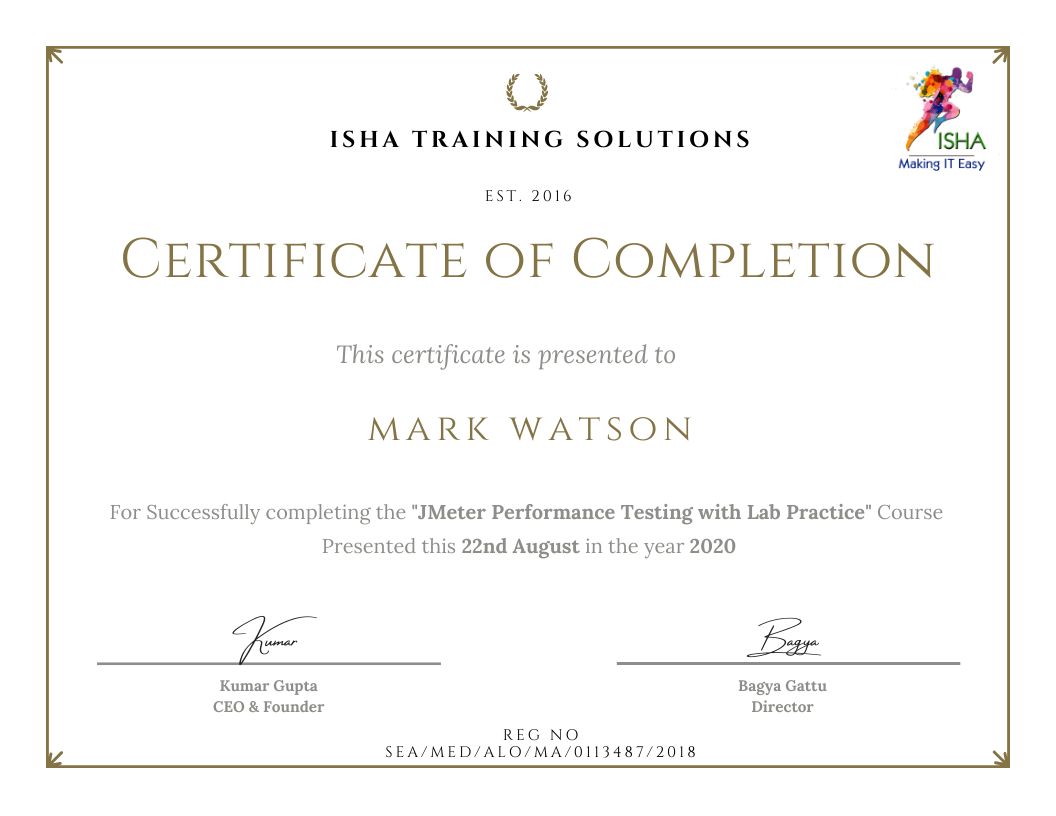
Sample Course Completion Certificate:
Your course completion certificate looks like this……
Reviews:


Course Features
- Lectures 78
- Quiz 0
- Duration 40 hours
- Skill level All levels
- Language English
- Students 1578
- Assessments Yes
- 10 Sections
- 78 Lessons
- 40 Hours
- Jmeter Introduction & Jmeter core concepts5
- 1.1JMeter History, Protocols Supported & Its Features
- 1.2Java (JDK & JRE) Installation & Java Environment/System Variable (or Home Path) Setup JMeter Download, Installation & Launching on Windows & Mac
- 1.3HTTP(s) Protocol: – Request, Response, Headers, Request Methods, & Status Codes
- 1.4Browser Developer Tool, HTTP/HTML Requests, Embedded Resources, Transaction (or User Action), Cookies, Cache, User Session
- 1.5Types of HTTP Request Methods & CRUD Operations: – GET, POST, PUT & DELETE
- Jmeter Scripting20
- 2.1Scripting using Docker, Kubernetes based demo application running on microservices
- 2.2JMeter’s 12 Major Elements (or Components)
- 2.3Port & Proxy Server Setup & Recording from Different Browsers
- 2.4Filtering Irrelevant Requests & Embedded Resources
- 2.5JMeter Certificate Installation in Different Browsers, Recording, & Certificate Regeneration
- 2.6HTTP(s) Test Script Recorder Element, Its Attributes, & Its Best Practices Settings
- 2.7JMeter’s Recording Best Practices
- 2.8Walk-through of JMeter’s Directory: – Various Files & Folders
- 2.9JMeter’s Properties Files
- 2.10JMeter Plugin Manager & Plugins Installation & Uninstallation
- 2.11Scenarios Identification & Documentation for Performance Testing of a Web Application (Product Booking Scenario)
- 2.12End to End Recording, Scripting & Enhancement of above Scenarios in JMeter
- 2.13JMeter’s Best Practices for Scripting & Enhancement
- 2.14Dynamic Values & Authorization Tokens, & Their Handling
- 2.15Correlation & Parameterization
- 2.16VUsers (or Threads), Ramp Up, Ramp Down, Loop, Think Time, Pacing
- 2.17Regular Expression in JMeter
- 2.18Regular Expression Extractor with Its Attributes in Detail
- 2.19Realtime Use Cases Examples of Dynamic Values Extraction in JMeter
- 2.20Beanshell scripting and challenges
- Jmeter Test Execution22
- 3.1Test Execution in Non-GUI Mode with Its Best Practices
- 3.2JMeter’s Java Heap Size Setting
- 3.3Understanding Test Summarizer
- 3.4JMeter HTML Dashboard Report Generation in Non-GUI Mode with Its Best Practices
- 3.5Importance of JTL file
- 3.6Changing Response Time Values to Seconds in HTML Report
- 3.7Decreasing the Summarizer Time
- 3.8Stopping Test Execution in Non-GUI Mode
- 3.9Test Execution & HTML Report Generation in GUI Mode
- 3.10Understanding JMeter HTML Report
- 3.11Saving Complete Requests & Responses for Failed Requests of a Test to a File
- 3.12Parameterizing Important Parameters Using __P() function & Why to Use this function?
- 3.13Passing Arguments from CLI in Non-GUI Execution
- 3.14Scope of JMeter Elements & Variables
- 3.15Local & Global Variables
- 3.16Execution Order (or Presidency) of JMeter Elements
- 3.17Relative & Absolute Path Setup in JMeter
- 3.18Debugging of Script in JMeter: – 4 helpful options
- 3.19CSV Data Set Config & Random CSV Data Set Config
- 3.20Distributed Load Testing in JMeter using Load Generators (LGs) in GUI & Non-GUI Modes (Master & Slaves Concept)
- 3.21Types of Performance Testing
- 3.22Test Run & Reporting
- JMeter Elements, Their Sub-Elements & Their Attributes in Detail14
- 4.1Test Plan
- 4.2Non-Test Elements
- 4.3Thread Group
- 4.4Controller Elements of JMeter
- 4.5Sampler Elements of JMeter
- 4.6Config Elements of JMeter
- 4.7Assertion Elements of JMeter
- 4.8Timer Elements of JMeter
- 4.9Listener Elements of JMeter
- 4.10Pre & Post Processor Elements of JMeter
- 4.11JMeter Web Services Execution
- 4.12JMeter REST services Execution
- 4.13JMeter Integration and analysis with Appdynamics, Influxdb, Grafana
- 4.14Jmeter integration with Jenkins
- AI-Powered Performance Testing0
- AI for Test Script Creation5
- AI for Load Test Setup3
- AI for Result Analysis3
- AI + Monitoring Integration3
- AI for Performance Testers3